Value Stream Mapping (VSM)
Identify waste, shorten lead time and improve flow in the production process.
Value Stream Mapping (VSM) is one of the key Lean Management tools that allows you to see the entire process – from order to delivery – and identify places generating losses.
What is Value Stream Mapping (VSM)?
A value stream map (VSM) is a Lean tool for visualizing the flow of materials and information within a process. It allows you to identify activities that add value and those that generate waste.
VSM allows you to:
- view the entire process end-to-end,
- identify bottlenecks,
- analyze information flow,
- identify areas for optimization.
How to do Value Stream Mapping (VSM) – step by step
- 1. Choose process and product family for mapping
- 2. Collect data: measure cycle times, changeover times, WIP, etc.
- 3. Map process in Current State
- 4. Identify waste on a map (MUDA)
- 5. Develop a concept for an improved state, incorporating Pull System techniques and Lean tools - Future State Map
- 6. Develop an implementation plan, should be no longer than 6 months
- 7. Implement / manage as a project
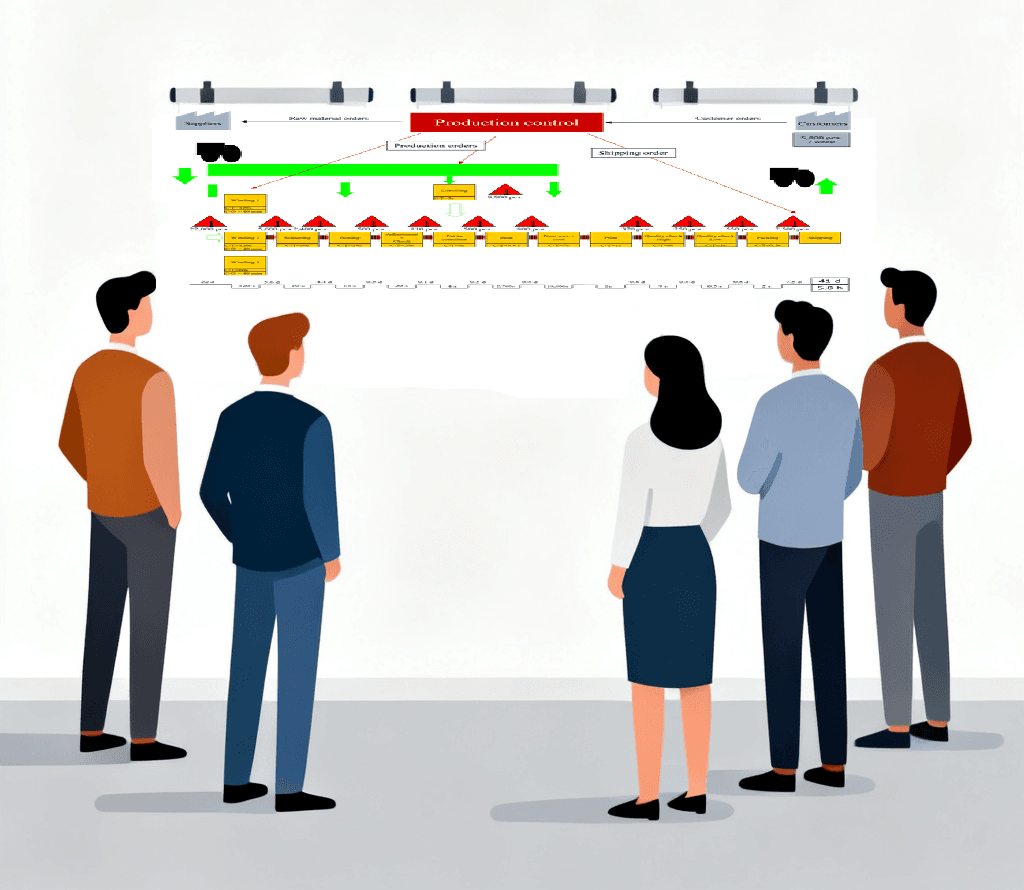
The VSM process is most often implemented in the form of a team workshop.
Why is it beneficial to use VSM?
Reduce Lead Time by 20%-30%
Reduce WIP by 40%-50%
Improve material and information flow
Improve interdepartamental cooperation
Eliminate waste (MUDA)
Value Stream Mapping enables decisions based on data, not assumptions.
Current State Map – what does it show?
Current State Map shows the actual material and process flow, including all its problems.
- Operation times and downtime
- Inventory levels
- Information flow
- Quality issues
- Bottlenecks
- other issues
Future State Map
The future state map shows what an optimized process should look like after eliminating waste and implementing Lean and Pull System solutions.
- Shortened Lead Time
- Smooth Flow
- Pull System
- Improved Work Balance
- Inventory Reduction
VSM implementation example
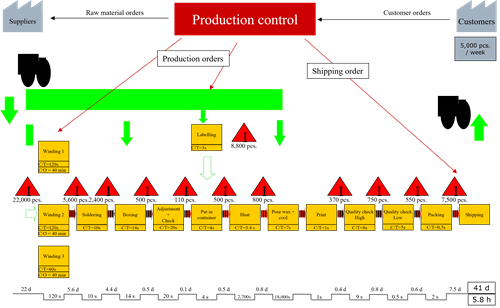
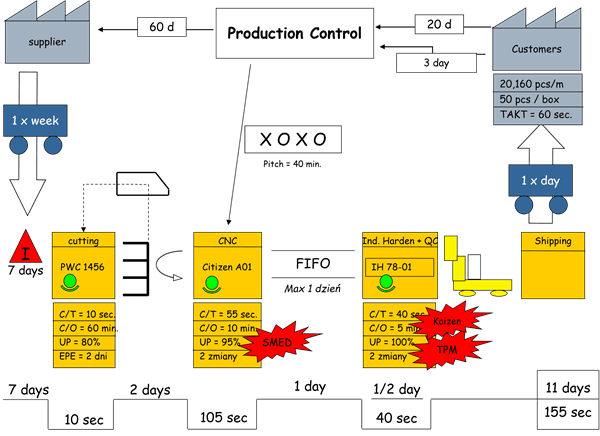
Description of Current State
The map shows the production process for splined shafts, which are a component of automobile alternators. For this product, the customers were alternator remanufacturers, while the main suppliers were steel producers.
The input material was steel rods, which were cut to the desired length on a saw. Next, the diameter was ground and the splines were machined on a CNC machine. The finished shaft was induction hardened, and the final step was manual straightening to achieve proper axial straightness.
The total processing time for one shaft was 170 seconds, while the average work-in-progress inventory level across the entire plant reached 28 days.
Reduce Lead Time by 60%
Redukcja WIP by 50%
Reduuce changeover time by 75%
Reduce breakdowns by 30%
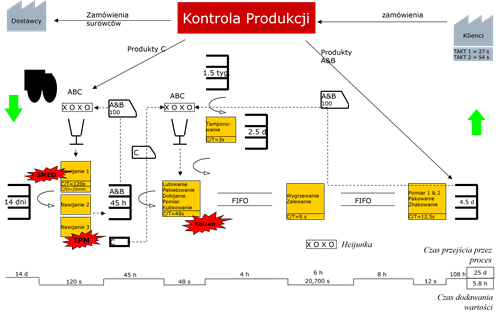
Description of Future State
To improve material flow, reduce inventory, and shorten order fulfillment times, the production process was redesigned based on Lean principles and the Pull system.
Key improvements
Reduction in Set-Up Time (SMED)
The set-up time on the CNC machine was reduced from 30 to 10 minutes and on the saw from 60 to 15 minutes. This significantly reduced production batch sizes and increased production flexibility.
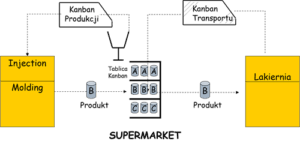
Implementation of a Supermarket and Flow Control
A supermarket for cut bars was introduced between the saw and the CNC.
This simplified planning – orders were sent only to the CNC production cell, and subsequent flow was controlled by Kanban and FIFO.
Combined operations
Induction hardening and quality control operations were combined into one cell, eliminating unnecessary handovers and reducing resource requirements.
Improved Reliability (TPM)
Cleaning and maintenance standards were implemented for the induction hardening machine, reducing downtime and improving process reliability.
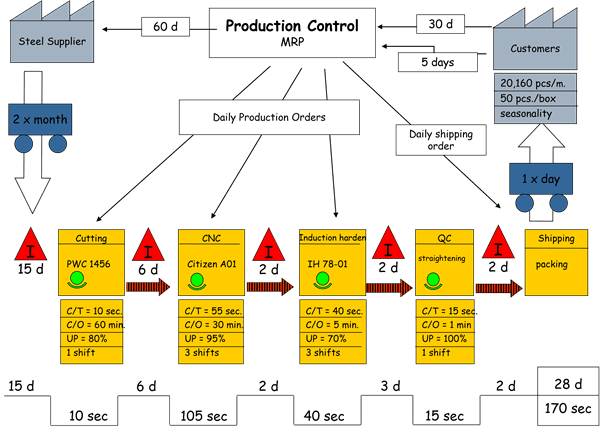
Business results
- Lead Time reduced by 60% (28 days to 11 dni)
- Significant reduction in WIP (50%)
- Simplified production planning
- More flexibility and shorter response time to customer orders
- Reduction of operating costs (including employment rationalization)
VSM vs Process Mapping - what is the difference?
Although both tools are used to analyze processes, they differ in scope and application.
| VSM | PROCESS MAPPING | |
|---|---|---|
| Mapping of production processes | YES | NO |
| Mapping of service processes | NO | YES |
| Detail level | Very general, high level overview | Flexible, can be adjusted to specific needs |
| Identification of WASTE | YES | YES |
| Identify Lead Time, Cycle Time | YES | YES |
| Show WIP | YES | NO |
| Identify bottlenecks | YES | YES |
VSM
VSM is a technique designed to eliminate waste in production processes. If you’re interested in streamlining service, business, or administrative processes, a better approach is process mapping using the Makigami technique.
Process Mapping
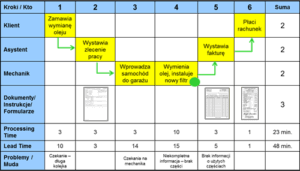
A process map created using the Makigami technique also shows process steps, operation times, and waste in the process.
Value Stream Mapping Workshop – What Does It Look Like?
A VSM workshop is an intensive teamwork event that analyzes a real-world company process.
- Duration: 1–3 days
- Multifuctional team: participation of employees from various departments
- Data and process analysis – Current State Map
- Development of a future state map
- Preparation of an action plan
- Designing an implementation phase
FAQ
Value Stream Mapping is a technique used by Toyota to map process flow and identify waste. It was popularized by the book Learning to See in the late 1990s.
Creating an improvement plan that will allow the implementation of the Pull System in the production process.
Unlike the “Push” system used in mass production, the “Pull” system ensures that only materials requested by downstream processes are produced and moved through the value stream.
Typically, 2 days are needed: one day to create the Current State map and another day for the Future State.
Additional time maybe required before the workshop to choose product families and collect data.
Click on a selected area inside the temple to view information about the tool
