A3 Problem Solving Methodology
Problem Solving methodology allows a dedicated team to identify details of a problem, gather data on the issue, analyze it for root causes, choose best solutions and implement them, thereby eliminating a problem forever. A typical length of a project is 3 to 12 weeks depending on the complexity of a problem.
The A3 method follows defined steps, more or less following the DMAIC scheme, borrowed from Six Sigma. The most frequently used tools in the analysis are Flowchart, 5W2H, Ishikawa Diagram, Pareto chart, 5Why, that visually illustrate the problem and turn opinions into facts.
Problem Solving is also known as Focused Improvement, Kobetsu Kaizen or Root Cause Analysis.
Flowchart
This diagram graphically represents process steps. It enables better understanding of a sequence of events to get the job done, identifies problem areas and stimulates ideas for improvement.
Ishikawa Diagram
Also known as a Fishbone diagram or cause and effect diagram, categorizes relationships among potential causes of a problem in order to find the root cause. Problem categories start with a letter M and the diagram can be 4M: Method, Machine, Material and Man, or 6M: 4M + Measures + Mother Nature.
5Why
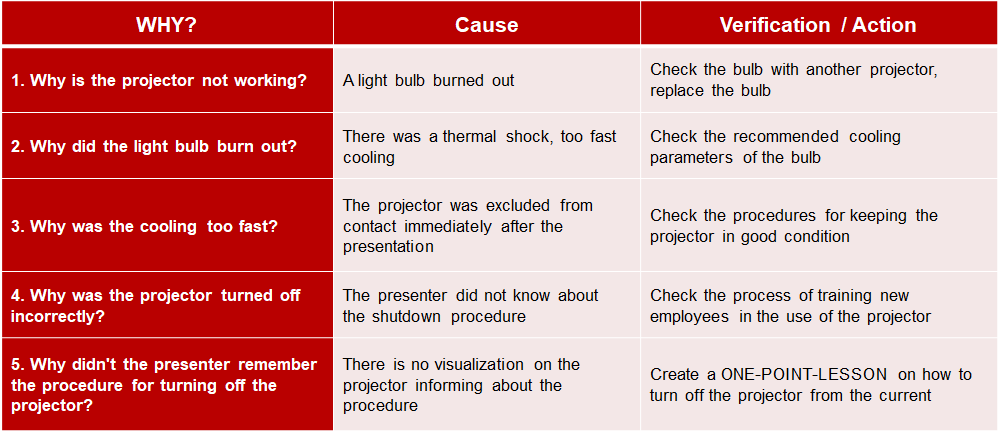
The 5Why method consists of asking the question “why” at least 5 times in a row to get to the root cause of the problem. The questions are linked so that each answer becomes the next questions. The success of the 5Why analysis depends on a thorough understanding of the problem and formulating the right answers that will lead to the underlying cause.
Pareto
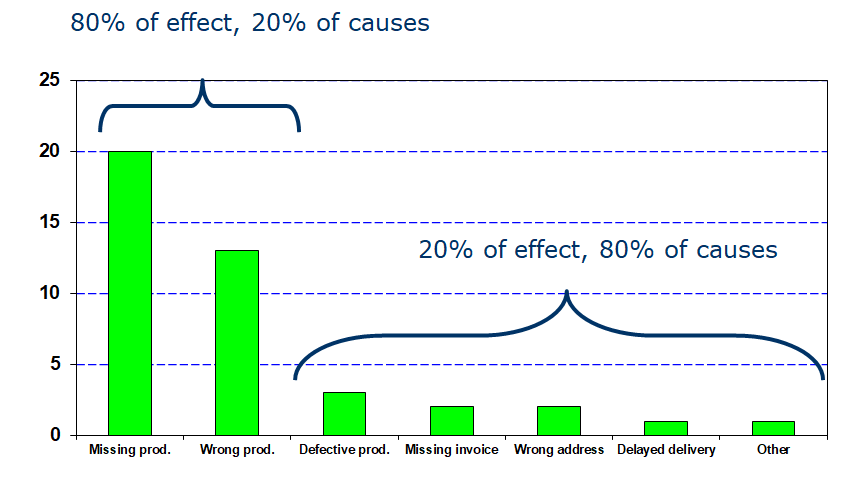
The Pareto Principle states that 80% of all results are caused by 20% of the causes. Therefore, this method allows to identify a few causes that have the greatest impact on emerging problems. By focusing corrective actions on these causes, most of negative effect can be removed with little effort, in comparison to attacking all of the causes at once.


