VPM - Visual Performance Management
Co to jest VPM?
Visual Performance Management jest wizualną metodą zarządzania, która umożliwia rozwiązanie problemów na bieżąco. VPM wpiera 5S w tworzeniu wizualnego środowiska pracy. VPM dostarcza aktualną informację na temat wydajności procesów i zapewnia ciągłe doskonalenie.
Aksjomat VPM
Czegoś czego nie można zmierzyć, nie można również usprawnić
Kategorie miar SQCDME
Visual Performance Management opiera się na analizie danych. Aby zagwarantować, że miary będą pokazywały wydajność procesu na wielu płaszczyznach, należy rozpatrzyć ich stworzenie w następujących kategoriach: Safety, Quality, Cost, Delivery, Morale i Environment.
SAFETY (bezpieczeństwo) | miary związane z bezpieczeństwem: ilość wypadków, zdarzeń niebezpiecznych, nieprawidłowe zachowania, problemy z bezpieczeństwem urządzeń |
QUALITY (jakość) | miary związane z jakością produktu, procesu, np. procent odpadów, ilość reklamacji |
COST (koszt) | miary związane z kosztami, np. czas przezbrojenia, ilość awarii, czas regulacji |
DELIVERY (dostawa) | miary związane z zaspokajaniem potrzeb klienta, np. ilość wyprodukowanych sztuk, terminowość dostawy |
MORALE (motywacja) | miary związane z zadowoleniem pracowników, np: przestrzeganie zasad 5S, ilość zgłaszanych pomysłów, wyniki ankiet |
ENVIRONMENT (środowisko) | miary związane z wpływem procesu na środowisko, np. ilość odpadów do recyklingu, zużycie mediów |
Różnicowanie miar w zależności od poziomu organizacji
- Linia produkcyjna – reprezentują pracę operatorów na każdej zmianie.
- Dział – reprezentują dobowe wyniki obszaru zarządzanego przez średni szczebel.
- Fabryka – reprezentują dzienne lub tygodniowe wyniki całego zakładu.
Porównanie miar na różnych poziomach zarządzenia
S | Q | C | D | M | E | |
LINIA / OBSZAR Miary procesu | Ilość niezgodnych zachowań | Ilość odpadów w kg | Czas przezbro-jenia | Ilość produkcji w kg | Liczba nierespekto-wanych standardów 5S | Ilość wycieków sprężonego powietrza |
WYDZIAŁ Miary procesu i kosztów | Ilość zdarzeń potencjalnie wypadkowych | % odpadów | OEE maszyn | Ilość zamówień nie wysłanych na czas | Liczba zgłoszonych pomysłów | Wyrzucona farba w kg |
FABRYKA Miary kosztów | Ilość wypadków na milion przepraco-wanych godzin | Ilość odpadów w PLN | Wydajność na pracownika | On Time Delivery w % | Zgłoszone pomysły na pracownika na rok | Koszty energii elektrycznej PLN |
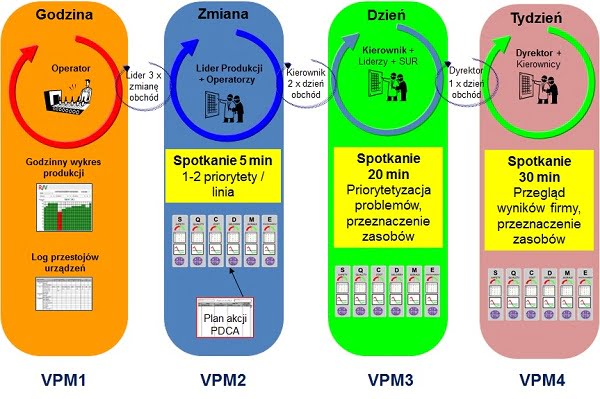
Cykle Zarządzania
- Cykl operatora – przedstawianie godzinnej wydajności produkcji i problemów z funkcjonowaniem maszyn
- Cykl lidera – spotkanie z pracownikami przy tablicy na linii na koniec każdej zmiany w celu omówienia wyników i priorytetyzacji działań zapobiegawczych
- Cykl kierownika produkcji – raz na dzień spotkanie z liderami przy tablicy na produkcji w celu dostarczenia zasobów do realizacji działań zapobiegawczych
- Cykl dyrektora zakładu – raz na tydzień spotkanie z managerami przy tablicy w celu priorytetyzacji działań ciągłego doskonalenia i zapewnienia zasobów
- VPM dla obszarów wsparcia, takich jak utrzymanie ruchu, kontrola jakości, magazyn, administracja działa podobnie, lecz na ogół jest mniej rozbudowany.